
How can I see the amount of RAM and swap? How do you know how much RAM is currently being used by the system and how much is available to run new applications? For this, there is in linux free utility.
Description of the free utility


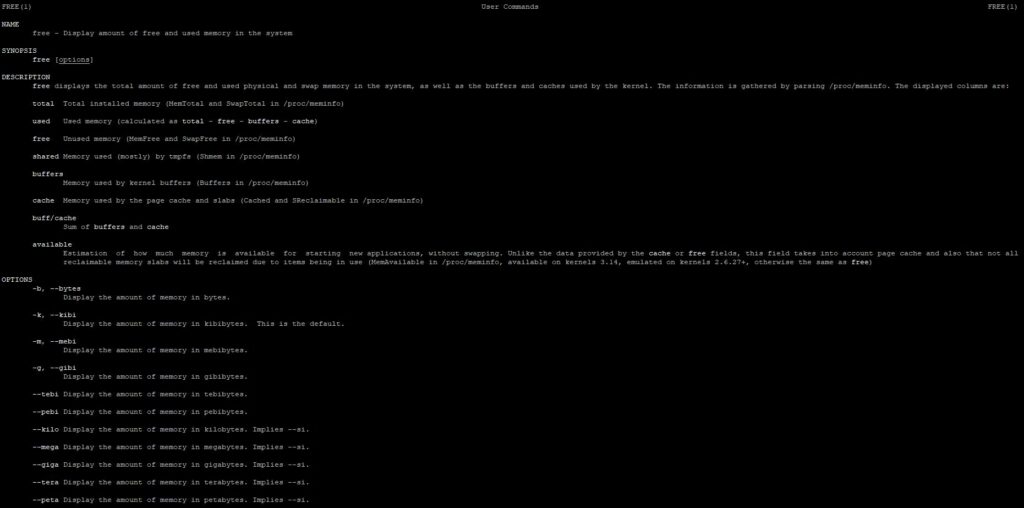
Linux free utility shows free and used memory on the system. Data is obtained by parsing /proc/meminfo.
When linux free utility launched without keys, the will display the following information:
$ free
              total        used        free      shared  buff/cache   available
Mem:        3871612     3444088      123092        4800      304432      199308
Swap:       3145724      977220     2168504
The output contains information about the physical memory Mem and the swap file Swap. The columns contain the following parameters:
total – total installed memory
used – used memory (calculated as total – free – buffers – cache)
free – unused memory
shared – memory used by (mostly) tmpfs
buff / cache – memory used by kernel buffers and page cache and slabs
available – available memory for launching new applications (excluding swap)
By default, all values of the listed parameters are specified in kibybytes (2 to the power of 10 = 1024).
Linux free utility: output format
The linux free utility can accept the following options to change output format:
-b, –bytes – display the amount of memory in bytes
-k, –kibi – display the amount of memory in kibibytes (this is the default)
-m, –mebi – display the amount of memory in mebibytes
-g, –gibi – display the amount of memory in gibibytes
–tebi – display the amount of memory in tebibytes
–pebi – display the amount of memory in pebibytes
For example, if we want to see the memory values in mebibytes, we use the -m switch:
$ free -m
              total        used        free      shared  buff/cache   available
Mem:           3780        3361         117           4         302         196
Swap:          3071        1015        2056
Likewise, there are the options –kilo, –mega, –giga, –tera, –peta. However, unlike those described above, which use a multiplier of 1024 during the conversion, in these keys this multiplier will be 1000.
–si – uses kilo, mega, giga, etc. (power of 1000) instead of kibi, mebi, gibi (power of 1024)
-h, –human – display memory values in human-readable form. The utility will automatically select the most suitable prefix (B, K, M, G, T, P with a multiplier of 1024):
$ free -h
              total        used        free      shared  buff/cache   available
Mem:          3,7Gi       3,2Gi       109Mi       4,0Mi       352Mi       239Mi
Swap:         3,0Gi       1,0Gi       2,0Gi
-w, –wide – switch output to extended mode, which provides more than 80 characters per line. In this mode, the buffers and cache parameters are divided into 2 columns:
free -h -w
              total        used        free      shared     buffers       cache   available
Mem:          3,7Gi       3,2Gi       107Mi       4,0Mi       145Mi       203Mi       232Mi
Swap:         3,0Gi       1,0Gi       2,0Gi
-l, –lohi – additionally displays statistics for the lowest and highest values:
$ free -h -l
              total        used        free      shared  buff/cache   available
Mem:          3,7Gi       3,2Gi       115Mi       4,0Mi       347Mi       240Mi
Low:          3,7Gi       3,6Gi       115Mi
High:            0B          0B          0B
Swap:         3,0Gi       1,0Gi       2,0Gi
-t, –total – additionally displays data on the total value of all memory (Mem + Swap):
$ free -h -t
              total        used        free      shared  buff/cache   available
Mem:          3,7Gi       3,2Gi       114Mi       4,0Mi       343Mi       234Mi
Swap:         3,0Gi       1,0Gi       2,0Gi
Total:        6,7Gi       4,3Gi       2,1Gi
-s, –seconds delay – continually refresh data with a delay specified in seconds. It is allowed to use microseconds after the dot. For example, let’s set the data update to 2.5 seconds:
$ free -h -s 2.5
              total        used        free      shared  buff/cache   available
Mem:          3,7Gi       3,2Gi       126Mi       4,0Mi       338Mi       241Mi
Swap:         3,0Gi       1,0Gi       2,0Gi

              total        used        free      shared  buff/cache   available
Mem:          3,7Gi       3,2Gi       126Mi       4,0Mi       338Mi       241Mi
Swap:         3,0Gi       1,0Gi       2,0Gi

              total        used        free      shared  buff/cache   available
Mem:          3,7Gi       3,2Gi       125Mi       4,0Mi       338Mi       240Mi
Swap:         3,0Gi       1,0Gi       2,0Gi
Every 2.5 seconds, a new output from the free command with updated data appears on the screen. To stop the command execution press Ctrl + C.
-c, –count count – display new data a certain number of times. It is required to specify the -s parameter with a delay time (if the switch is omitted, the default value of 1 second will be used).
Let’s see the change in used memory with a difference of 60 seconds:
$ free -h -c2 -s60
              total        used        free      shared  buff/cache   available
Mem:          3,7Gi       3,2Gi       113Mi       4,0Mi       339Mi       229Mi
Swap:         3,0Gi       1,0Gi       2,0Gi

              total        used        free      shared  buff/cache   available
Mem:          3,7Gi       3,3Gi       212Mi       4,0Mi       339Mi       229Mi
Swap:         3,0Gi       1,0Gi       2,0Gi
In this case, after 60 seconds and the second output, the free utility will automatically finish its work.
-V, –version – view the current version of the free utility:
$ free -V
free from procps-ng 3.3.15
–help – displays brief help on using the utility:
$ free --help

Usage:
 free [options]

Options:
 -b, --bytes         show output in bytes
     --kilo          show output in kilobytes
     --mega          show output in megabytes
     --giga          show output in gigabytes
     --tera          show output in terabytes
     --peta          show output in petabytes
 -k, --kibi          show output in kibibytes
 -m, --mebi          show output in mebibytes
 -g, --gibi          show output in gibibytes
     --tebi          show output in tebibytes
     --pebi          show output in pebibytes
 -h, --human         show human-readable output
     --si            use powers of 1000 not 1024
 -l, --lohi          show detailed low and high memory statistics
 -t, --total         show total for RAM + swap
 -s N, --seconds N   repeat printing every N seconds
 -c N, --count N     repeat printing N times, then exit
 -w, --wide          wide output

     --help     display this help and exit
 -V, --version  output version information and exit

For more details see free(1).
You can find even more useful Linux utilities on this page.